The Most and Least Car-Dependent States [Complete Study]
Discover practical ways to embrace sustainability and create a greener future. Learn how small changes in your daily life can make a big difference. From eco-friendly habits at home to sustainable transportation options, explore actionable steps to reduce your carbon footprint. Dive into the world of mindful consumption and eco-conscious choices that contribute to a more sustainable planet.
Read more


Table of Contents
Table of Contents

Published Author & Insurance Expert
Peyton Leonard is an insurance and finance writer living in Colorado Springs, CO. She is currently obtaining her Bachelor’s in English at Thomas Edison State University. Peyton is the author of “Lyme & Not the Fruit.” She also has experience writing for the business magazine, Productivity Intelligence Institute.
Peyton Leonard

Sr. Director of Content
Sara Routhier, Senior Director of Content, has professional experience as an educator, SEO specialist, and content marketer. She has over 10 years of experience in the insurance industry. As a researcher, data nerd, writer, and editor, she strives to curate educational, enlightening articles that provide you with the must-know facts and best-kept secrets within the overwhelming world of insurance....
Sara Routhier

Licensed Insurance Producer
Dani Best has been a licensed insurance producer for nearly 10 years. Dani began her insurance career in a sales role with State Farm in 2014. During her time in sales, she graduated with her Bachelors in Psychology from Capella University and is currently earning her Masters in Marriage and Family Therapy. Since 2014, Dani has held and maintains licenses in Life, Disability, Property, and Casualt...
Dani Best
Updated October 2024
Welcome to our comprehensive article on “The Most and Least Car-Dependent States.”

In this insightful piece, we delve into the fascinating world of car dependence and explore which states in the United States rely the most and the least on cars for transportation.
Nationally, 85 percent of adults aged 16 and older have a driver’s license. Annually, these drivers log 3.2 trillion miles.
We examine a range of factors including public transportation availability, walkability, bike-friendliness, and average commute times to determine the rankings. Along the way, we discuss the impact of car dependence on the environment, health, and quality of life, shedding light on the importance of alternative modes of transportation.
To make informed decisions about your car insurance, we invite you to enter your ZIP code and compare rates from the best insurance providers in your area. Take the first step towards a more sustainable and cost-effective transportation future while ensuring your vehicle is protected with the right coverage.
As the U.S. population has grown, so has the number of vehicles on the road. In fact, the increase in the total number of vehicles on American roads has outpaced population growth since the 1960s. Of the 272 million vehicles (including private and public automobiles, buses, trucks, and motorcycles) driven today, 109 million are privately-owned passenger vehicles.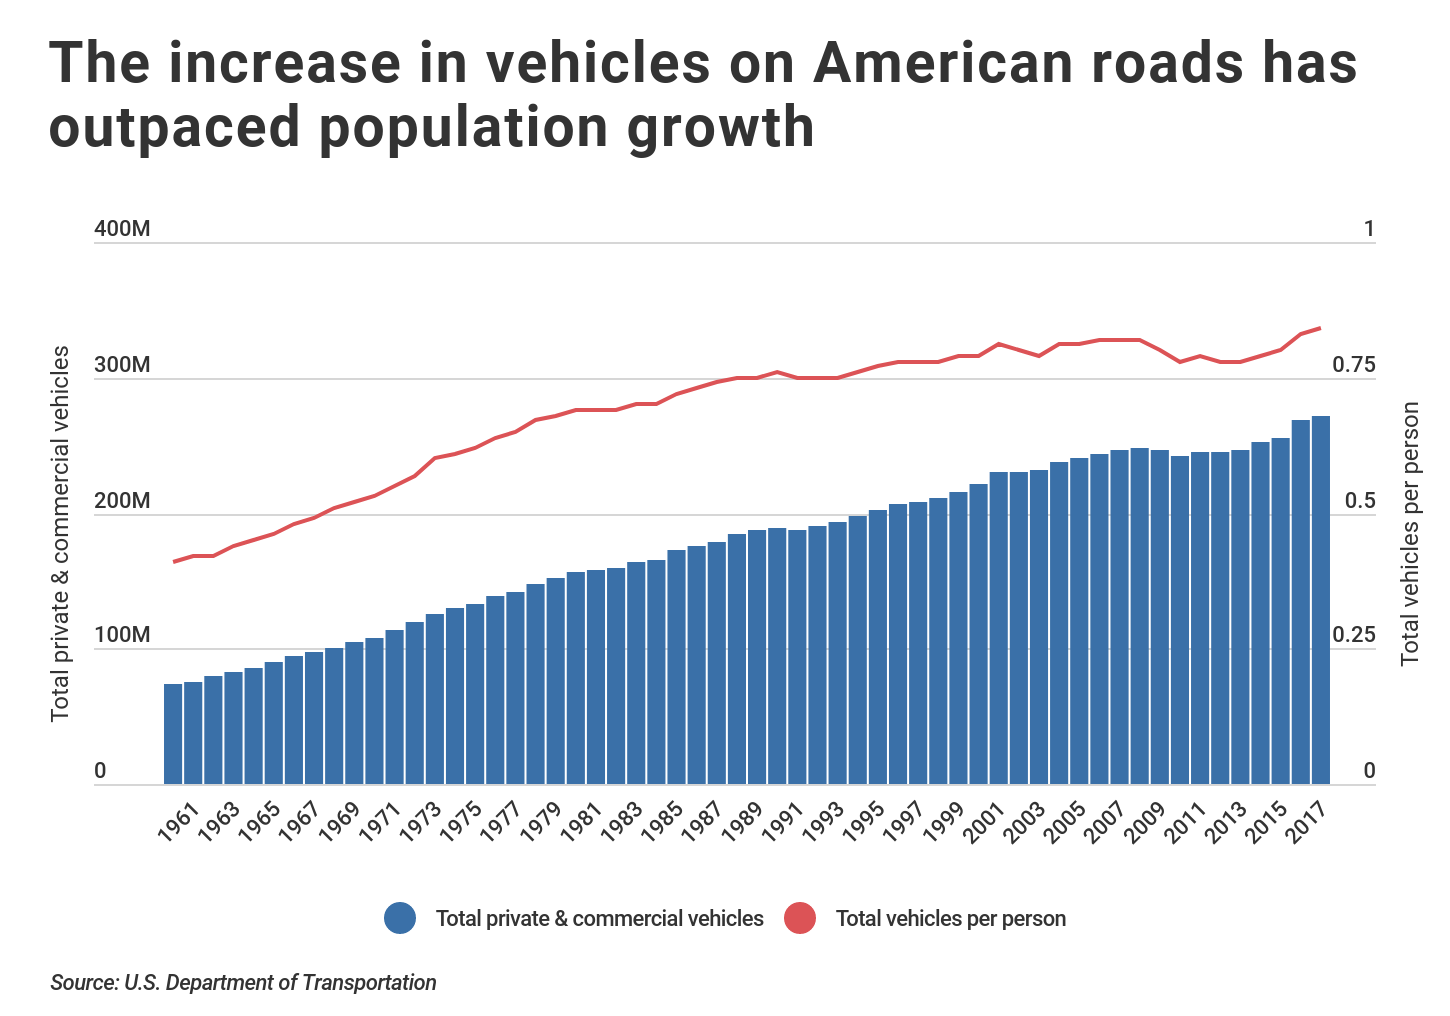
RELATED
The more time you spend behind the wheel, the more important it is to have the best auto insurance. We can help you easily compare car insurance coverages from the best providers.
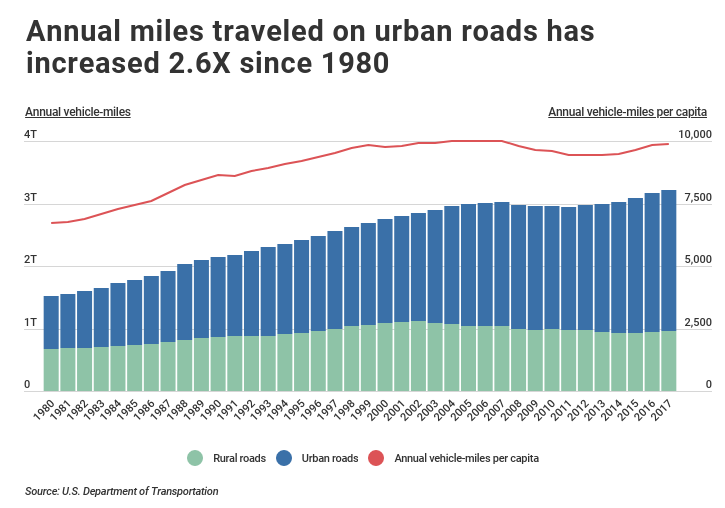
As the number of vehicles per person has grown, so has the average distance traveled per year. The latest data from the U.S. Department of Transportation shows that U.S. drivers log about 10,000 miles per year, up from roughly 7,000 miles in the 1980s. Over the past several decades, the largest increases have occurred in urban areas. As a result, city roads are increasingly congested, prolonging commute times and adding to Americans’ daily stress.
The wasted time spent in the car is also costly. Research firm INRIX found that Americans lose 97 hours a year to traffic jams and slow-moving drivers. The lost hours translate to a cost of $87 billion a year.
That said, the stress and financial strain caused by increased time spent behind the wheel doesn’t impact residents throughout the country uniformly. To identify the most car-dependent states in the U.S., our researchers analyzed data from the U.S. Department of Transportation and the U.S. Census Bureau. We created a composite car-dependency in America index based on the following factors and weights:
- Annual miles driven per person – 50%
- Workers who commute by car – 30%
- Number of passenger vehicles per person – 10%
- Adults 16+ with a driver’s license – 10%
This article covers the 20 states: 10 that are the most car-dependent states and 10 that are the least car-dependent. This factor plays into car insurance rates for these states. If you’re looking to find car insurance in your community, visit our insurance quote comparison page for access to insurance company reviews and local agents and brokers.
If you live in an area that’s auto dependent, it’s important to get good car insurance rates. Enter your ZIP code into our FREE online quote comparison tool to find the best rates for your area.
In the frequently asked questions section of this article, we’ll cover additional topics like:
- American Car dependency definition
- Most Car-dependent cities in the US
- How to reduce car dependency in USA
- Negative impacts of automobile dependency
Now, back to the study. Here’s what we found:
Study’s Key Takeaways
Overall, the car-dependency in the U.S. index ranges from a high of 98.81 to a low of 50.8. The most car-dependent states largely exist in the southern part of the U.S.. Conversely, least car centric cities in the US are generally found on the West Coast or in the Northeast.
Rural versus urban density plays an important role in determining car dependency. The least car-dependent states have low percentages of residents living in rural areas. The opposite is true for states at the high end of the index. Residents in rural areas are less likely to have access to public transportation and are more likely to require a car for daily commuting and other responsibilities.
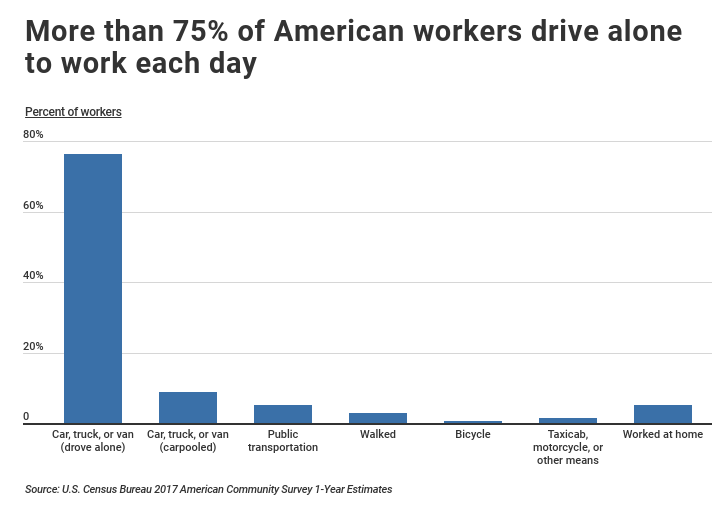
While driving has increased overall, a smaller share of U.S. employees are using their personal vehicles to get to work.
In a 10-year span from 2007 to 2017, Census reported a 1.2 percentage point drop in workers who commute by car.
Among the least car-dependent states, the drop was as great as 5.4 percentage points in the District of Columbia. Conversely, in the most car-dependent states, these numbers generally stayed the same or increased over the same time period.
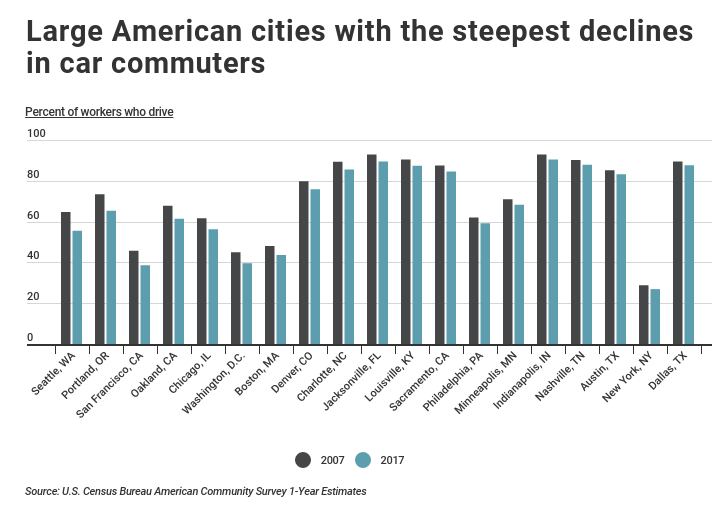
Among the largest U.S. cities, Seattle, Portland, and San Francisco experienced the greatest decreases in car commuters since 2007, at 9.2, 8.1, and 7.1 percentage points, respectively.
Free Auto Insurance Comparison
Compare Quotes From Top Companies and Save
The Most Car-Dependent States
#1 – Alabama
- Car-dependency index: 98.81
- Annual miles driven per person: 14,499
- Number of passenger vehicles per person: 0.41
- Adults 16+ with a driver’s license: 100%
- Workers who commute by car: 94.2%
- 10-year change in workers commuting by car: No significant change
Driving more often and during unusual hours can result in accidents as we’ve seen in recent years with the hazards of drowsy driving. Learn more about the dangers of drowsy driving to prevent you from becoming a victim.
#2 – Tennessee
- Car-dependency index: 91.97
- Annual miles driven per person: 12,247
- Number of passenger vehicles per person: 0.34
- Adults 16+ with a driver’s license: 98%
- Workers who commute by car: 92.0%
- 10-year change in workers commuting by car: -1.4 percentage points
#3 – Arkansas
- Car-dependency index: 90.80
- Annual miles driven per person: 12,112
- Number of passenger vehicles per person: 0.30
- Adults 16+ with a driver’s license: 100%
- Workers who commute by car: 93.2%
- 10-year change in workers commuting by car: No significant change
#4 – Mississippi
- Car-dependency index: 90.49
- Annual miles driven per person: 13,698
- Number of passenger vehicles per person: 0.27
- Adults 16+ with a driver’s license: 86%
- Workers who commute by car: 94.6%
- 10-year change in workers commuting by car: +0.8 percentage points
In Mississippi, not all cars are created equal, at least according to car thieves. Check out our article about the most stolen cars in Mississippi to see if your car is a top target.
#5 – North Dakota
- Car-dependency index: 90.21
- Annual miles driven per person: 12,863
- Number of passenger vehicles per person: 0.36
- Adults 16+ with a driver’s license: 93%
- Workers who commute by car: 89.8%
- 10-year change in workers commuting by car: +1.9 percentage points
DID YOU KNOW?
Regardless of your situation, we can help you find the right auto insurance policy. Whether you are looking for car insurance for a single parent or auto insurance for a 21-year-old, we’ve got you covered.
#6 – Oklahoma
- Car-dependency index: 89.41
- Annual miles driven per person: 12,568
- Number of passenger vehicles per person: 0.34
- Adults 16+ with a driver’s license: 80%
- Workers who commute by car: 92.1%
- 10-year change in workers commuting by car: No significant change
Read more: Oklahoma Car Insurance Discounts
#7 – Missouri
- Car-dependency index: 87.63
- Annual miles driven per person: 12,417
- Number of passenger vehicles per person: 0.35
- Adults 16+ with a driver’s license: 86%
- Workers who commute by car: 90.6%
- 10-year change in workers commuting by car: No significant change
And you should know: St. Louis, Missouri, is a deadly city for U.S. drivers as it ranks in the top 10 deadliest cities for drivers.
#8 – New Mexico
- Car-dependency index: 87.46
- Annual miles driven per person: 14,214
- Number of passenger vehicles per person: 0.29
- Adults 16+ with a driver’s license: 88%
- Workers who commute by car: 90.0%
- 10-year change in workers commuting by car: No significant change
#9 – Indiana
- Car-dependency index: 86.96
- Annual miles driven per person: 12,263
- Number of passenger vehicles per person: 0.34
- Adults 16+ with a driver’s license: 85%
- Workers who commute by car: 91.2%
- 10-year change in workers commuting by car: -1.4 percentage points
#10 – Wyoming
- Car-dependency index: 86.57
- Annual miles driven per person: 16,890
- Number of passenger vehicles per person: 0.33
- Adults 16+ with a driver’s license: 91%
- Workers who commute by car: 88.1%
- 10-year change in workers commuting by car: No significant change
The Least Car-Dependent States
#1 – New York
- Car-dependency index: 50.80
- Annual miles driven per person: 6,234
- Number of passenger vehicles per person: 0.23
- Adults 16+ with a driver’s license: 74%
- Workers who commute by car: 59.4%
- 10-year change in workers commuting by car: -2.1 percentage points
Compare quotes from the top insurance companies and save!Compare The Best Insurance Quotes In The Country
#2 – District of Columbia
- Car-dependency index: 53.34
- Annual miles driven per person: 5,354
- Number of passenger vehicles per person: 0.28
- Adults 16+ with a driver’s license: 89%
- Workers who commute by car: 39.6%
- 10-year change in workers commuting by car: -5.4 percentage points
#3 – Hawaii
- Car-dependency index: 56.37
- Annual miles driven per person: 7,529
- Number of passenger vehicles per person: 0.35
- Adults 16+ with a driver’s license: 81%
- Workers who commute by car: 80.8%
- 10-year change in workers commuting by car: -2.4 percentage points
#4 – Alaska
- Car-dependency index: 56.67
- Annual miles driven per person: 7,460
- Number of passenger vehicles per person: 0.23
- Adults 16+ with a driver’s license: 92%
- Workers who commute by car: 81.1%
- 10-year change in workers commuting by car: No significant change
#5 – New Jersey
- Car-dependency index: 57.07
- Annual miles driven per person: 8,607
- Number of passenger vehicles per person: 0.31
- Adults 16+ with a driver’s license: 85%
- Workers who commute by car: 78.9%
- 10-year change in workers commuting by car: -2.1 percentage points
TRENDING
Members of wholesale clubs often have access to reduced car insurance rates. Learn more about buying insurance at wholesale clubs like Sam’s Club Auto Insurance or BJ’s Auto Insurance.
Read more: Sams Clubs Car Insurance Discount
#6 – Illinois
- Car-dependency index: 58.71
- Annual miles driven per person: 8,437
- Number of passenger vehicles per person: 0.36
- Adults 16+ with a driver’s license: 82%
- Workers who commute by car: 80.8%
- 10-year change in workers commuting by car: -2.2 percentage points
#7 – Massachusetts
- Car-dependency index: 59.70
- Annual miles driven per person: 9,134
- Number of passenger vehicles per person: 0.32
- Adults 16+ with a driver’s license: 86%
- Workers who commute by car: 77.3%
- 10-year change in workers commuting by car: -3.9 percentage points
Massachusetts is frequently featured on lists of the states with the best drivers. Part of the credit may go to its rigorous road test and requirements for teens to get a driver’s license.
Additional education is one of many discounts available to younger drivers, who may have very high car insurance rates. Go to our cheap car insurance for young drivers page to find the best insurance for your teenager.
Compare quotes from the top insurance companies and save!Compare The Best Insurance Quotes In The Country
#8 – Pennsylvania
- Car-dependency index: 59.71
- Annual miles driven per person: 7,935
- Number of passenger vehicles per person: 0.34
- Adults 16+ with a driver’s license: 84%
- Workers who commute by car: 84.7%
- 10-year change in workers commuting by car: -1.4 percentage points
#9 – California
- Car-dependency index: 62.25
- Annual miles driven per person: 8,697
- Number of passenger vehicles per person: 0.37
- Adults 16+ with a driver’s license: 84%
- Workers who commute by car: 83.9%
- 10-year change in workers commuting by car: -1.1 percentage points
California is one of the only states to outlaw the use of non-driving factors to set car insurance rates. See our answer to the question, “How are car insurance rates determined?” for more information.
#10 – Oregon
- Car-dependency index: 62.36
- Annual miles driven per person: 8,872
- Number of passenger vehicles per person: 0.37
- Adults 16+ with a driver’s license: 85%
- Workers who commute by car: 81.4%
- 10-year change in workers commuting by car: -3.1 percentage points
Full Study Results
The Most Car Dependent States
| Rank | States | Car Dependency Index | Annual Miles Driven per Person | Passenger Vehicles per Person | Adults 16+ with a Driver's License | Workers who Commute by Car | 10-yr Change: Commuting by Car |
|---|---|---|---|---|---|---|---|
| 1 | Alabama | 98.81 | 14,499 | 0.41 | 100% | 94.2% | No change |
| 2 | Tennessee | 91.97 | 12,247 | 0.34 | 98% | 92.0% | -1.4% |
| 3 | Arkansas | 90.8 | 12,112 | 0.3 | 100% | 93.2% | No change |
| 4 | Mississippi | 90.49 | 13,698 | 0.27 | 86% | 94.6% | +0.8% |
| 5 | North Dakota | 90.21 | 12,863 | 0.36 | 93% | 89.8% | +1.9% |
| 6 | Oklahoma | 89.41 | 12,568 | 0.34 | 80% | 92.1% | No change |
| 7 | Missouri | 87.63 | 12,417 | 0.35 | 86% | 90.6% | No change |
| 8 | New Mexico | 87.46 | 14,214 | 0.29 | 88% | 90.0% | No change |
| 9 | Indiana | 86.96 | 12,263 | 0.34 | 85% | 91.2% | -1.4% |
| 10 | Wyoming | 86.57 | 16,890 | 0.33 | 91% | 88.1% | No change |
| 11 | South Carolina | 85.49 | 11,046 | 0.34 | 93% | 91.3% | -0.8% |
| 12 | Kentucky | 84.33 | 11,055 | 0.37 | 84% | 91.4% | -0.9% |
| 13 | South Dakota | 83.83 | 11,088 | 0.4 | 91% | 89.0% | +1.6% |
| 14 | Montana | 83.73 | 12,037 | 0.42 | 94% | 85.4% | No change |
| 15 | Kansas | 83.52 | 11,073 | 0.34 | 88% | 91.2% | No change |
| 16 | Nebraska | 82.95 | 10,938 | 0.35 | 92% | 90.8% | +1.7% |
| 17 | Delaware | 82.75 | 10,881 | 0.43 | 97% | 89.2% | No change |
| 18 | North Carolina | 82.46 | 11,600 | 0.32 | 88% | 89.9% | -1.8% |
| 19 | Wisconsin | 82.05 | 11,271 | 0.36 | 89% | 88.8% | No change |
| 20 | Iowa | 80.88 | 10,644 | 0.4 | 89% | 89.4% | No change |
| 21 | Louisiana | 80.78 | 10,508 | 0.29 | 91% | 91.9% | No change |
| 22 | Vermont | 80.5 | 11,905 | 0.35 | 100% | 84.0% | No change |
| 23 | Georgia | 79.99 | 11,960 | 0.33 | 85% | 88.6% | -1.2% |
| 24 | Ohio | 78.55 | 10,258 | 0.39 | 84% | 91.0% | No change |
| 25 | New Hampshire | 77.84 | 10,189 | 0.37 | 97% | 89.2% | No change |
| 26 | Michigan | 76.96 | 10,214 | 0.32 | 87% | 91.2% | -0.7% |
| 27 | West Virginia | 76.96 | 10,503 | 0.3 | 76% | 91.8% | No change |
| 28 | Maine | 76.17 | 11,032 | 0.29 | 92% | 87.9% | -1.1% |
| 29 | Florida | 74.71 | 10,428 | 0.37 | 86% | 88.4% | -1.7% |
| 30 | Minnesota | 73.84 | 10,754 | 0.38 | 76% | 86.2% | -0.9% |
| 31 | Idaho | 72.85 | 10,076 | 0.32 | 88% | 89.3% | +1.3% |
| 32 | Virginia | 69.92 | 10,066 | 0.38 | 86% | 86.0% | -2.2% |
| 33 | Texas | 69.13 | 9,644 | 0.29 | 77% | 90.4% | -0.7% |
| 34 | Utah | 68.45 | 10,147 | 0.29 | 86% | 86.8% | -1.1% |
| 35 | Arizona | 68.25 | 9,274 | 0.34 | 91% | 87.5% | -0.8% |
| 36 | Nevada | 66.38 | 9,202 | 0.35 | 79% | 88.3% | -1.0% |
| 37 | Connecticut | 65.78 | 8,779 | 0.36 | 87% | 86.1% | -1.3% |
| 38 | Maryland | 65.68 | 9,921 | 0.33 | 88% | 82.8% | -1.7% |
| 39 | Rhode Island | 65.19 | 7,551 | 0.39 | 85% | 88.8% | No change |
| 40 | Colorado | 64.8 | 9,520 | 0.32 | 91% | 83.4% | -1.7% |
| 41 | Washington | 64.03 | 8,294 | 0.39 | 96% | 81.9% | -2.6% |
| 42 | Oregon | 62.36 | 8,872 | 0.37 | 85% | 81.4% | -3.1% |
| 43 | California | 62.25 | 8,697 | 0.37 | 84% | 83.9% | -1.1% |
| 44 | Pennsylvania | 59.71 | 7,935 | 0.34 | 84% | 84.7% | -1.4% |
| 45 | Massachusetts | 59.7 | 9,134 | 0.32 | 86% | 77.3% | -3.9% |
| 46 | Illinois | 58.71 | 8,437 | 0.36 | 82% | 80.8% | -2.2% |
| 47 | New Jersey | 57.07 | 8,607 | 0.31 | 85% | 78.9% | -2.1% |
| 48 | Alaska | 56.67 | 7,460 | 0.23 | 92% | 81.1% | No change |
| 49 | Hawaii | 56.37 | 7,529 | 0.35 | 81% | 80.8% | -2.4% |
| 50 | District of Columbia | 53.34 | 5,354 | 0.28 | 89% | 39.6% | -5.4% |
| 51 | New York | 50.8 | 6,234 | 0.23 | 74% | 59.4% | -2.1% |
| National Average | United States | 65.59 | 9,862 | 0.34 | 85% | 85.3% | -1.2% |
Free Auto Insurance Comparison
Compare Quotes From Top Companies and Save
Methodology: Determining the Most and Least Car-Dependent States
To identify the most car-dependent states, a composite car-dependency index was calculated based on the following factors and weights:
- Annual miles driven per person (50%): Annual vehicle-miles traveled divided by the state population.
- Workers who commute by car (30%): The percentage of workers who commute by car, truck, or van.
- Number of passenger vehicles per person (10%): Number of privately-owned automobiles divided by the state population.
- Adults 16+ with a driver’s license (10%): The total number of licensed drivers in the state divided by the population 16 and over. In some instances, the resulting car-dependency statistic slightly exceeded 100%. This could be the result of certain residents moving out-of-state and not yet transferring their license. For the purpose of this analysis, we capped these values at 100%.
The data used was sourced from the following reports and surveys:
- Vehicle-miles traveled, vehicle registrations, and driver’s license statistics are from the U.S. Department of Transportation’s Federal Highway Administration.
- Commuting statistics and population estimates are from the U.S. Census Bureau 2017 American Community Survey 1-Year Estimates.
Being car-dependent likely means your car insurance rates are higher than typical. Enter your ZIP code into our online quote generator to find the cheapest rates in your area.
Frequently Asked Questions
What is car dependency?
Car dependency refers to the extent to which people rely on cars to meet their transportation needs.
Which cities in the US are the most car-dependent?
The most car-dependent cities are generally found in the southern part of the US, while the least car-dependent cities are generally found on the West Coast or in the Northeast.
How can we reduce car dependency?
Reducing car dependency can be achieved through a combination of strategies such as improving the public transportation car-dependent infrastructure, encouraging active transportation (such as biking and walking), and creating more walkable and bikeable communities.
Car-centric cities are characterized by urban environments where automobile usage dominates daily transportation. These cities often feature sprawling layouts designed around cars, with extensive road networks and limited pedestrian or cycling infrastructure. Car-centric infrastructure prioritizes highways, parking spaces, and suburban developments that cater primarily to private vehicle travel. Such car-dependent infrastructure not only influences daily commuting patterns but also contributes to issues like traffic congestion, air pollution, and urban sprawl, emphasizing the need for sustainable urban planning and alternative transportation options.
What are the negative impacts of automobile dependency?
The negative impacts of auto dependency include increased traffic congestion, air pollution, and greenhouse gas emissions, as well as decreased physical activity levels and increased risk of traffic accidents.
Does car dependency impact car insurance rates?
Yes, car dependency can impact car insurance rates. States with higher car dependency may have higher car insurance rates due to higher risk of accidents and other factors. It’s important to compare car insurance rates in your area to find the best deal.
What is the car-dependency index?
The car-dependency index is a composite index based on factors such as annual miles driven per person, workers who commute by car, number of passenger vehicles per person, and adults 16+ with a driver’s license. It is used to measure the extent of car dependency in each state.
What are the most car-dependent states?
The most car-dependent states are Alabama, Tennessee, Arkansas, Mississippi, North Dakota, Oklahoma, Missouri, New Mexico, Indiana, and Wyoming.
What are the least car-dependent states?
The least car-dependent states are generally found on the West Coast or in the Northeast, and include New York, Massachusetts, District of Columbia, Rhode Island, Connecticut, New Jersey, Maryland, Vermont, Pennsylvania, and Washington.
What are the most car-dependent cities?
The term most car-dependent cities refers to urban areas where automobile usage is particularly prevalent and necessary for daily transportation. Cities like Los Angeles, known for its extensive freeway system and sprawling layout, exemplify high levels of car dependence. Houston and Dallas in the United States share similar characteristics with decentralized layouts and limited public transportation options, necessitating widespread car ownership.
When did America become car dependent?
America’s dependency on cars began to solidify in the early to mid-20th century with the rise of automobile production and infrastructure development. The 1920s saw significant growth in car ownership, and by the post-World War II era, suburbanization and the expansion of highways cemented cars as a primary mode of transportation for many Americans.
Why are American cities so car dependent?
Why is car dependency bad?
Is America car dependent?
What percentage of Americans own cars?
What are the automobiles per capita or cars per capita by state in the US?
What is the most car-dependent country in the world?
What is the most car-dependent city?
Which country has the most car owners?
Which country has the least cars?
What city has the least cars?
What state uses the most cars?
What is the most car-dependent city?
What state drives the most cars?
What is the most car-dependent country?
Which country has the most people per car?
How many automobiles are there in the United States?
How many cars are on the road in the US?
How many passenger cars are there in the US?
How many people own a car in America?
Related Articles
-
Oct 2024

Tips for Winter Driving Safety – Everything You Need to Know
-
Jun 2026
States with the Most (& Least) Gun Deaths [+ Causes]
-
Oct 2024
Light Pollution Effects in Your Life: Impact on Driving, Health, and Home Safety
-
Oct 2024
History Review: The Submarine & Submersible Vehicles
-
Oct 2024
Home Remodeling and Modifications for People with Special Needs
-
Oct 2024
The Life of Water: A Guide to the Water Cycle


Get a FREE Quote in Minutes
Insurance rates change constantly — we help you stay ahead by making it easy to compare top options and save.